
Uber is driven by analytics. The fastest-growing company ever, by some accounts, Uber uses up-to-date information to entice customers, direct drivers, and run their business on a database that provides answers with sub-second response times. In this presentation, James Burkhart of Uber explains how SingleStore has helped solve critical latency issues for the company at a critical point in its growth. We encourage you to review the key points listed here, then view the presentation from Strata + Hadoop World 2017 and review the slides on Slideshare.
Four Challenges for Uber Analytics
What is real-time analytics? Real-time analytics is a special case of operational analytics. Real-time analytics means providing fast answers – usually in a second or less – to queries, and including recent information in the response. Real-time analytics often requires streaming data, as a fast way to get new data into the analytics system, and a highly responsive database, which combines new information with existing information and provides results very quickly.
Uber needs to connect drivers and passengers in real time. It needs to add or remove surge pricing smoothly as demand changes throughout the day. Uber’s entire business model is based on real-time data. SingleStore helps Uber make real-world decisions based on analytical results that the company uses to take action on the go.
Uber wanted to overcome four challenges:
- Business Intelligence
- Real-time analytics
- Time series aggregates
- Geospatial data
Uber was looking at metrics for just about every important aspect of their business: riders, drivers, trips, financials, etc. So business intelligence is the first challenge. An example of an actionable metric could be something like a surge of business in a contained geographic area. The action to take in response is to physically reposition supply in the real world.
They wanted this to be in real time, which is the next challenge is. Before using SingleStore, Uber was facing a p99 ingest latency somewhere between 1.5 seconds on the lower end of sources, and 3 minutes on the higher end, depending on the ingestion source. They needed consistent responsiveness in fractions of a second, to a few seconds at the maximum, for all sources.
Another area of interest is aggregation of time series data. In their real-time analytics system, Uber does not store the entire history of all time series data; there are other systems to do this. In this system, they want business metrics, which have strong seasonality components and are looked at in that context.
The real-time analytics system is not a source of truth, but a source for aggregated data. For example, a morning commute has very different marketplace dynamics than a Friday night out on the town. An example query for this purpose would be something like, “Hourly count of trips in San Francisco.” The whole system is designed and optimized for aggregated data, not individual records.
Geospatial data is the final key point. Uber’s business is operating across the physical world, and they need to be able to provide granular geospatial slicing and dicing of data to help analysts understand various marketplace properties of some geo-temporal segment of data. Knowing that, somewhere in San Francisco, that the unfulfilled rate of requests went up at a particular point in time is not useful, as compared to understanding that, for example, near AT&T Stadium, when a San Francisco Giants game let out, there was a spike representing an increase in demand.
The slide (available in this Uber presentation on Slideshare) shows an example of all of these issues coming together. It shows aggregated demand for Uber rides on New Year’s Eve 2016 (orange dots) vs. the early hours of New Year’s Day 2017 (green dots). You can see where demand is and the hour of the day, all relative to the terminator – the line between one day to another, which sweeps across the globe every 24 hours. In the slide, the terminator is moving across the Arabian peninsula and eastern Europe, where it’s midnight, and heading toward very dense concentrations of Uber demand, as 2016 is ending and 2017 approaching, across Europe and key cities in Africa, such as Cairo, Egypt.

Why Uber Needs A SQL Database for Analytics
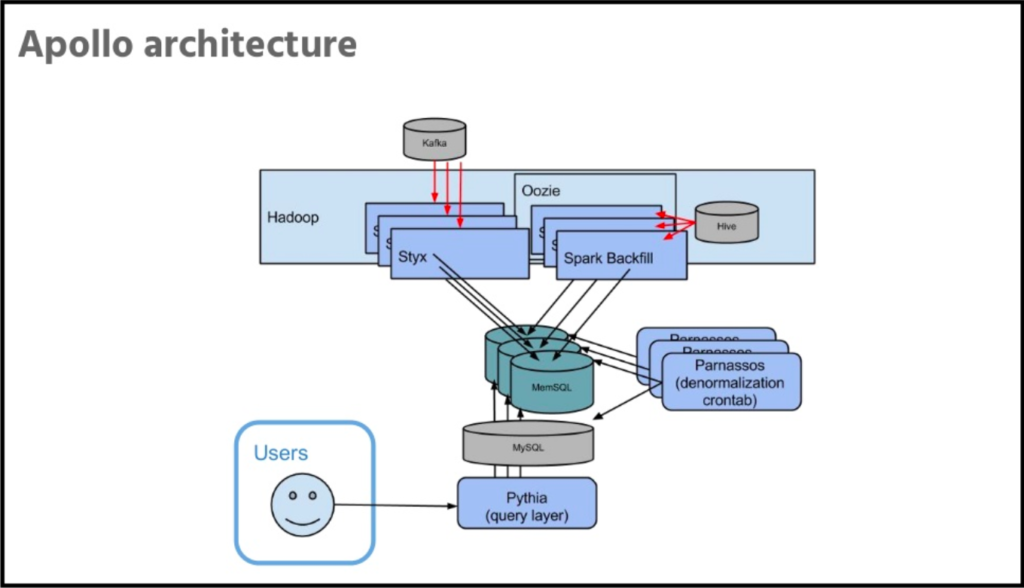
Apollo is Uber’s internal platform for real-time analytics. Uber stores only recent data, that’s about seven weeks’ worth. They have low latency on ingestion, usually measured in seconds, between data being logged and making that data available for query. Apollo supports ad hoc exploration of data, arbitrary drill down including geospatial filtering and geospatial dimensioning of data.
Another key property is deduplication. Use of Kafka is pretty heavy at Uber. With Kafka deployment, it ends up getting an at-least-once delivery guarantee. But one of the flaws in the existing system, the one that Uber has replaced with Apollo, was that it would double count in a lot of scenarios involving hardware or software failures. They needed to be able to assert that a uniquely identifiable record exists exactly once, and would not be double-counted with this system. And they have to do all of this with low latency to the end user.
So SingleStore is where Uber stores the data. They investigated some alternatives during the research and planning phase, but found that SingleStore serves their needs well. They find it to be super fast, that it supports ingestion at a rate significantly beyond their requirements, and that it meets their reliability needs.
Another feature that they started using, somewhat after the initial implementation, is SingleStore’s columnstore, alongside the in-memory rowstore. They started moving some of the older data into columnstore periodically, which can reduce storage costs by 90% plus in some cases. (Editor’s note: This is partly due to strong data compression in columnstore, in addition to the lower cost of storage on disk – as used for columnstore – vs. storage in memory, as used in rowstore.)
Conclusion
In summary, James described how SingleStore provided a fast, responsive, scalable solution that allows Uber to run important parts of their business using SingleStore as a standard SQL database. In the conclusion to the presentation, James goes on to talk about many specifics of the Apollo system, including Apollo Query Language (AQL), their query layer on top of SQL. He shows how they optimized many aspects of the system to support AQL while delivering high performance.
To learn more about how Uber maximized their use of SingleStore, view the recorded presentation and review the slides. Also, you can get started with SingleStore for free today.