
Performance is in SingleStore’s DNA. Last March, we shattered the trillion-rows-per-second scan barrier for processing a single SQL query on industry-standard Intel servers. That query processed data from a single table, and of course, lots of analytical queries use multiple tables, particularly star schemas. So we’ve broadened our vectorized, single instruction, multiple data (SIMD) query execution technology beyond single-table, group-by aggregate queries to star join group-by aggregate queries.
A star join is a common kind of query that operates on what’s known as a star schema, used in most data warehouses and data marts, and some operational analytics applications as well. In a star schema, a single large table called a fact table is linked to several smaller tables called dimension tables. Star join queries typically join these tables together, aggregate numeric “measure” columns from the fact table, and group by descriptive fields from the dimension tables.
Our star join performance was already excellent. This improvement makes it ludicrously good.
In addition to star join performance improvements, we’ve made many other improvements to query and load speed, as I’ll describe in this blog post.
When combined with SingleStore’s existing high performance, what this improvement means for application developers building real-time analytics systems, data warehouses, and data marts is that they can use SingleStore to get stunning performance at concurrency levels they couldn’t have dreamed of before. And they can do it with a database that supports mixed workloads and runs ANSI SQL.
Star Join Performance Improvements
We’ve added proprietary, patent-pending new algorithms for star join that make use of vectorization and SIMD. These algorithms operate directly on our compressed columnstore data formats, which we call encoded data. Instead of doing a hash join in the traditional way, where each row of the “probe-side” table is used to do a function call to search into a hash table created from the “build-side” table, we now have a special implementation of hash join that doesn’t do function calls in the inner loop. Instead, it uses generated, templatized code to process part of the work for multiple probes at once in a single SIMD instruction, operating directly on encoded data.
To demonstrate this, I created a basic star schema data set. Since we have quite a few customers in the media market, I made a media-oriented example with one fact table and three dimensions, like so:
| Table | Number of rows | Description |
|---|---|---|
| `media_view_fact` | 1,310,720,000 | Fact table describing a view event for a media object (e.g., a web page) |
| `date_dim` | 2,556 | One row with descriptive properties for each day for 7 years |
| `user_dim` | 1,000 | One row for each system user |
| `item_dim` | 10,000 | One row for each media item being tracked |
I created a basic, but realistic, star join query that forces processing of every single row from the fact table, does a join, and groups by columns from a dimension, as follows:
select d_daynuminweek, d_dayofweek, count(*) as c
from media_view_fact f, date_dim d
where f_datekey = d_datekey
group by 1, 2
order by 1 asc;
The hardware I used was a single Intel Skylake server with two 2.6Ghz processors and 56 total cores. Data was partitioned evenly with one partition per core. I configured the system with one SingleStore aggregator node and two SingleStore leaf nodes, one leaf for each processor. The system had non-uniform memory access (NUMA) enabled and each leaf was on a separate NUMA node.
I ran this query twice – once with, and once without, the new encoded join capability enabled. The results are summarized below:
| Encoded joins enabled? | Average runtime 30 runs |
|---|---|
| no | 3.01s |
| yes | 0.0297s |
| speedup (times) | 101 |
No, this is not a typo. This is a 101 times speedup!
The data is not pre-aggregated. The speedup is due to operating directly on encoded data, using SIMD and the enhanced join algorithm.
What does this mean? Now, all existing applications can get far faster response times and concurrent throughput. Even more exciting is that you can create new applications that allow interactive analytics on large data sets with rapidly changing data, without resorting to the complexity of pre-aggregating data.
More complex queries also show substantial speedups. For example, here’s a four-way star join with filters.
select d_dayofweek, count(*)
from media_view_fact, date_dim, user_dim, item_dim
where f_datekey = d_datekey
and f_userkey = u_userkey
and f_itemkey = i_itemkey
and i_itemuri regexp 'http://www.c000[0-5].*'
and u_zipcode like '002%' and
d_year = 1997 and d_month = "January"
group by d_dayofweek;
The results are as follows:
| Encoded joins enabled? | Runtime |
|---|---|
| no | 0.09s |
| yes | 0.03s |
| speedup (times) | 3 |
The fact table is sorted (keyed) by f_datekey, and we’ve supported range (segment) elimination via join since our 6.0 release. So the date range filter implied by this join requires us to only read one year of data, not all seven years. And the filter effects of the join are employed during the scan of the fact table both with and without encoded joins enabled, via Bloom filters or a related approach we use in SingleStoreDB Self-Managed 6.7. So the speedup is not as dramatic as the 101X speedup for the previous query. But a 3X speedup, on top of SingleStore’s generally high performance, is amazing nevertheless!
Star Schema Benchmark Release-to-Release Gains
The well-known star schema benchmark (SSB) was already performing very well in SingleStoreDB Self-Managed 6.5, mainly because the joins in the queries in SSB are highly selective. That means that most rows in the fact table are filtered out by joins with the dimension tables. So vectorized testing of Bloom filters, available in 6.5, worked well to speed up these queries. Still, the new star join query execution technology in 6.7 has further improved this workload.
The hardware for this test used four AWS m4.2xlarge leaf nodes (8 logical cores, 32GB RAM each). The primary fact table has 600 million rows. There are no precomputed aggregates. Query results are computed from scratch.
This chart illustrates the gains:
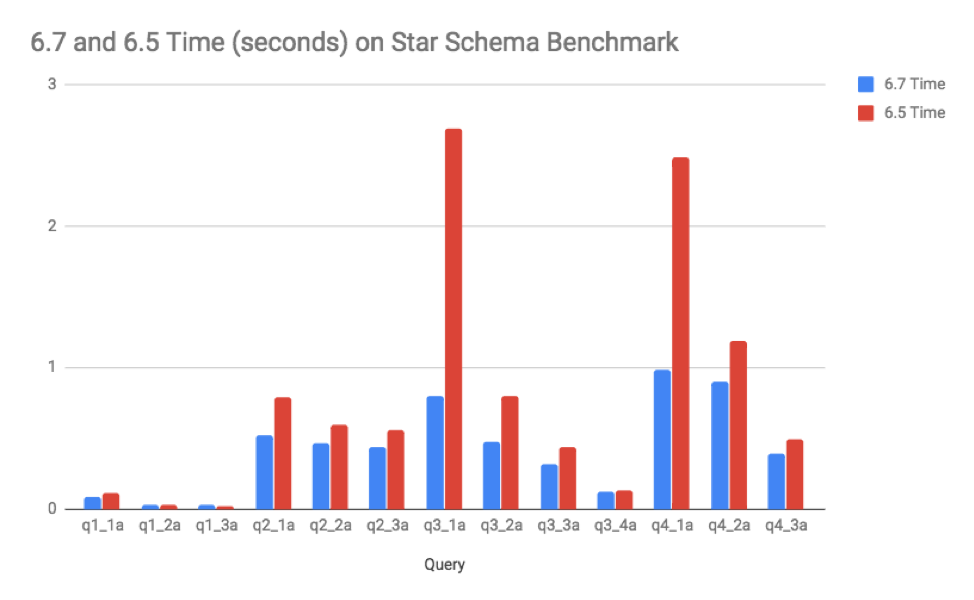
Notice that the most expensive queries, q3_1a and q4_1a, speeded up the most. And now, all the queries run in less than one second — truly interactive.
What do I have to do to get this speedup?
To get this speedup, join fact tables to dimension tables on integer columns and use group-by and aggregate operations in your queries. Using a star or snowflake schema with integer surrogate keys is a best practice and has been taught for years as part of the Kimball methodology, the most popular schema approach for data warehouses, data marts, and business intelligence systems. If you use this methodology, or something close to it, you’ll naturally benefit from the star join performance enhancements in SingleStoreDB Self-Managed 6.7.
As the number of rows that qualify from a dimension table in your query increase, the time to process each fact table row will increase, due to the need to do random memory access into a larger and larger hash table as part of the hash join operation. Eventually this may scale beyond cache memory size, which will result in more time spent per row. Best performance will be achieved for smaller sets of rows on the build side (tens of thousands or less).
Additional Performance Improvements
SingleStoreDB Self-Managed 6.7 has a number of great performance improvements beyond this star join improvement, including:
- Just-in-time compilation of queries (experimental)
- IN-list performance improvement
- Resource governor enhancements for CPU and concurrency
- Columnstore range filter improvements
- Intra-cluster network compression for load data
- Fast sampled rowstore scans
- Optimizer and statistics improvements
I elaborate on these additional improvements below.
Just-in-time compilation of queries
SingleStore compiles queries to machine code, which allows us to get amazing performance, particularly when querying our in-memory rowstore tables. By spending a bit more time compiling than most databases – which interpret queries, rather than compiling them – we get high performance during execution. This works great for repetitive query workloads. But our customers have been asking for better performance the first time a query is run, which is especially applicable for ad hoc workloads.
In SingleStoreDB Self-Managed 6.5, we introduced an undocumented feature that you enable with “set interpreter_mode = interpret_first”. In 6.5, this caused the first run of a query to be interpreted rather than compiled. This works well unless the first run of the query touches a lot of data, in which case, there is a noticeable loss of performance compared with just compiling and running the first time.
In SingleStoreDB Self-Managed 6.7, interpret_first has been improved to essentially be a just-in-time (JIT) compiler. JIT is an advanced compiler technique that compiles code once interpretation has been done enough times. We compile each operator of the query in the background, and switch to compiled mode from interpreted mode dynamically, while the first execution of the query is running. This can speed up the first run of a large and complex query (say with more than seven joins) several times by reducing compile overhead, with no loss of performance on longer-running queries for their first run.
The interpret_first setting of interpreter_mode is still experimental. The default is llvm (compiled). Users can start using it for new application development, as we expect to make it fully supported for production next year. Let us know if you have feedback on it.
IN-list performance improvement
Queries with IN-lists are quite common in analytical applications. We’ve made them faster in SingleStoreDB Self-Managed 6.7 in a couple of ways:
- Aggregators only send queries to leaves that hold the partitions responsible for the IN-list elements
- IN conditions are tested with a hash table, to allow fast qualification of whether a row is in, or not in, the list
The first item primarily improves queries with smaller IN lists.
Resource governor enhancements for CPU and concurrency
In SingleStoreDB Self-Managed 6.7, we extended our resource governor (RG) to allow you to limit use of CPU by resource pools, and limit the number of queries concurrently executing in a pool. This will not speed up an individual query on a lightly loaded system, but it can improve overall performance on a busy system for high-priority work items, and improve overall throughput. This requires correctly configuring RG for the characteristics of your application.
For example, you can set the SOFT_CPU_LIMIT_PERCENTAGE for your pool named “high_priority” to be 30 percent. This guarantees that work in the high-priority pool always can have at least 30 percent of the CPU when the system is heavily loaded. It’s a soft limit, but if other pools are using more than 70 percent total, when needed, the CPU can be taken away from them for the high_priority pool in a fraction of a second.
In addition, if you have a well-known gigantic query, you can put it in its own pool and limit the concurrency of that pool to 1, so only a single instance of it can run at a time. This can avoid thrashing and out-of-memory errors, while letting smaller reports run without waiting.
Columnstore filter improvements
Range filters on integer-encoded columns in columnstore tables are now faster. Range filters are those filters that use <, <=, >, >=, or BETWEEN. In SingleStoreDB Self-Managed 6.7, these are implemented using Intel AVX2 SIMD instructions that operate directly on encoded data. Simple tests show speedups in the range of roughly three to six times for integer range filters.
In addition, filter operations on integer run-length-encoded columns have speeded up by about a factor of two compared with SingleStoreDB Self-Managed 6.5. This was achieved with low-level performance tuning, continuing to use SIMD.
Intra-cluster network compression for load data
During loading with the standard SingleStore loader, the LOAD DATA command, data needs to be copied from one node to another, which can make the cluster network the limiting factor in load speed. As of SingleStoreDB Self-Managed 6.7, we sense when there is a network delay (based on the number of outstanding requests to send data from one node to another). If there is, then we switch to use data compression on the stream of data flowing between nodes. See our blog post on the development of this feature.
This is fully automatic and on by default. As a result, some LOAD DATA commands will more than double in speed! This will be most visible when CPU is more plentiful than network bandwidth in your cluster.
Fast sampled rowstore scans
A new SingleStoreDB Self-Managed 6.7 feature, which was introduced to help the query optimization process but can help with query execution as well, is the sampled rowstore scan. This uses the randomized nature of the SingleStore in-memory skiplist that is used for rowstore tables. It allows you to sample a percentage, p, of the rows of a table, t, in an amount of time that’s directly proportional to the size of the sample. And this is a high-quality, row-level random sample where individual rows are independently selected (a Bernoulli sample). Repeated samples at the same sampling ratio may retrieve the same or nearly the same set of rows, however.
Legacy database systems sometimes support sampling, but typically either they support random samples of pages (which is not truly random, due to clustering) or they require a full scan of a table to compute a row-level sample (which can be slow). SingleStore samples are both high quality and fast. A user with statistical savvy could use this feature to compute averages with, say, a 99 percent confidence interval, very fast, on a large and rapidly-changing data set in a transaction processing application.
As an example, for a table, f, that contains 100 million rows, on the hardware described earlier, this query takes on average about 74 milliseconds:
select avg(duration_s) from f;
And this query takes on average about 2.2 msec:
select avg(duration_s) from f with (sample_ratio = 0.00001);
Yet the sampled version produces results with accuracy within 1 percent of the full scan version for random values of duration_s in the range of 0 to 120.
Optimizer and Statistics Improvements
The query optimizer doesn’t make queries execute faster, but a good query optimizer of course can improve performance of your application overall by choosing good query plans for queries. We are in the process of improving the query optimizer and statistics subsystem of SingleStore over multiple releases, to make it easy to get great query plans with little or no tuning required.
Rowstore random samples
In SingleStoreDB Self-Managed 6.7, we have updated our sampling strategy for rowstore tables to use a true, row-level random sample, as described above, rather than read an entire single partition, as was done in SingleStoreDB Self-Managed 6.5 and earlier. This has two benefits:
- The sample can run faster because less data has to be sampled
- The sample is a uniform, random one, so it is high quality and not subject to skew
A cardinality estimate is an estimate produced by the optimizer of the number of rows that are produced by a query plan operator. There are a number of trouble spots that make it hard for the optimizer to get good cardinality estimates with just statistics. Trouble spots include:
- Complex predicates, such as
myUDF(column_name) = 1 - Correlation, such as the famous problem,
make = 'Honda' and model = 'Accord'" - Situations where there are no statistics
So, when your queries contain complex predicates, correlated filters, or when statistics are not available, you will still be able to get good estimates of cardinality based on a sample when using rowstores.
Better IN-list filter estimation
SingleStoreDB Self-Managed 6.7 now can use advanced histograms, introduced in 6.5, to more accurately estimate the selectivity of IN conditions.
Query optimization performance
We’ve made a several improvements to query optimization performance (i.e., the amount of time it takes to generate a query plan tree from SQL input). These are related to metadata loading performance and internal caching techniques to reduce optimizer run time. Optimization time for some customer queries has improved up to sixfold.
New information_schema views for tuning
Tuning your physical database design well can give you big performance gains across your workload. With SingleStore, you have to choose indexes (rowstore vs. columnar), table types, and make decisions about sharding. In SingleStoreDB Self-Managed 6.7, we’ve introduced new management views, in information_schema, to help you make these decisions. The first is mv_query_column_usage. This view helps you understand which queries are using different columns in your database and how. It has these columns to help you know which queries are using a column, whether the column is used in joins, filters, group-bys, order-bys, reshuffles, or is output to the client application. Based on the understanding of the frequency and cost of use of columns for different purposes, you can make better decisions about where to create indexes and how to shard your data.
The management view mv_aggregated_column_usage provides a summary of mv_query_column_usage, aggregating over the columns without providing detail for individual queries.
Query plan warnings
Application developers sometimes introduce simple things in their queries that might affect performance in an unanticipated way, such as comparing an integer column to a string or vice versa unintentionally. SingleStoreDB Self-Managed 6.7 now warns you about these situations in EXPLAIN plan output, as well as in a new information_schema.mv_queries view. You can find all queries with warnings like this:
select * from information_schema.mv_queries where PLAN_WARNINGS != ""
Statistics views
Statistics are fundamental information used by the optimizer to help it find the best-performing query plan. We’ve added or changed these information_schema views to help you understand what statistics are available, how old they are, and whether potentially useful statistics are missing.
| View | Description |
|---|---|
| `mv_query_prospective_histograms` | Shows what queries could have used histograms on a particular column but they weren’t available |
| `optimizer_statistics` | Shows what statistics are available for each column that has any kind of statistics, and when they were last updated |
Summary
SingleStoreDB Self-Managed 6.7 has been a short release focused on usability. Nevertheless, we’ve delivered amazing performance gains in the database engine, especially for star joins. If you have an analytical application and are joining on integer keys then grouping and aggregating, you may see stunning speed improvements, over 100X in some cases. And we’ve continued to improve other areas including the speed of IN-list filters, columnstore integer column filters, and LOAD DATA. Finally, general improvements to our optimizer and statistics/sampling framework, as well as maturation of our resource governor to handle CPU and concurrency limits, make it easier to get great performance and maintain it over time with SingleStoreDB Self-Managed 6.7.
Try SingleStoreDB Self-Managed 6.7 today to see what gains you can get for your workload!
References
- Shattering the Trillion-Rows-Per-Second Barrier With SingleStore (SingleStore blog post).
- Kimball, Ralph, The Data Warehouse Lifecycle Toolkit, 2nd Edition, 2008. Note: this is a great reference on dimensional modeling (the star schema approach).
For more information on SingleStoreDB Self-Managed 6.7, see the press release and all eight blog posts on the new version: Product launch; managing and monitoring SingleStoreDB Self-Managed 6.7 (includes SingleStore Studio); the new free tier; performance improvements (this post); the Areeba case study; the Wag! case study; the creation of the Visual Explain feature; and how we developed adaptive compression.