This post originally appeared on the Pinterest Engineering Blog by Bryant Xiao.
As a data driven company, we rely heavily on A/B experiments to make decisions on new products and features. How efficiently we run these experiments strongly affects how fast we can iterate. By providing experimenters with real-time metrics, we increase our chance to successfully run experiments and move faster.
We have daily workflows to compute hundreds of metrics for each experiment. While these daily metrics provide important insights about behavior, they typically aren’t available until the next day. What if the triggering isn’t correct so that Pinners are not actually logged? What if there’s a bug that causes a big drop in the metrics? What about imbalanced groups? Before the real-time dashboard, there was no way to tell until the next day. Also, any subsequent changes / corrections would require another day to see the effect, which slows us down.
The real-time experiment dashboard solves these problems. Here we’ll share how we build the real-time experiment metrics pipeline, and how we use it to set up experiments correctly, catch bugs and avoid disastrous changes early, including:
- Setting up the real-time data pipeline using SingleStore
- Building the hourly and on-demand metrics computation framework
- Use cases for real-time experiment metrics
Data Pipeline
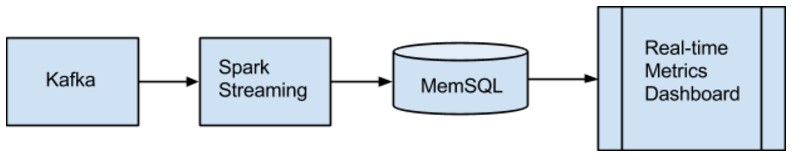
Below is the high level architecture of the real-time experiment metrics.
Streamliner
Streamliner is an integrated SingleStore and Apache Spark solution for streaming data from real-time data sources such as Kafka. We use it ingest data from Kafka and persist into SingleStore (Kafka -> Spark Streaming -> SingleStore). The latency is sufficient for our near real-time analysis.
SingleStore
SingleStore is a high throughput, highly scalable, highly compatible distributed relational database. Its high performance querying capability allows us to do near real-time ad-hoc analysis. We use SingleStore as our real-time database to store all the data, with a 24-hour retention policy. The data stored in SingleStore is used to compute scheduled and on demand metrics. The result is then used to populate the dashboard.
Dashboard
SingleStore provides several ways to connect to SingleStore backend using popular MySQL-compatible clients and libraries. We use the Python library provided by SingleStore to connect to the database and run scheduled jobs or on-demand queries.
The real-time experiment metrics dashboard consists of two parts:
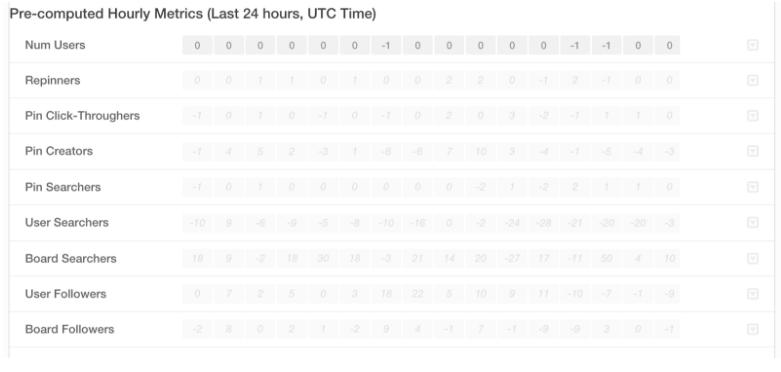
- Pre-computed hourly metrics within the last 24 hours
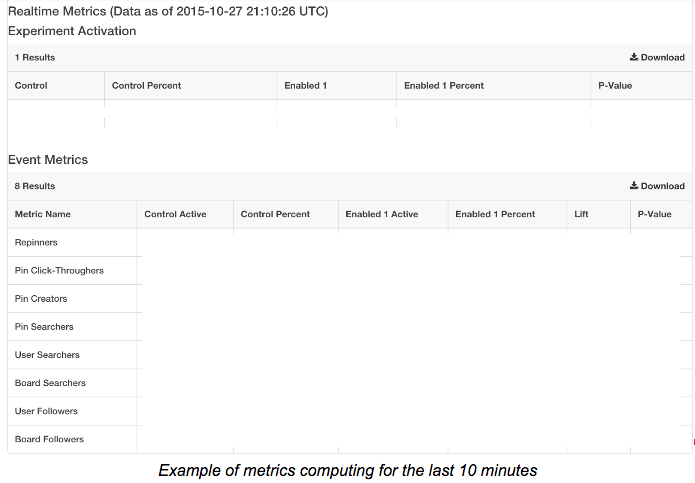
- Real-time metrics within the last hour
Pre-Computed Metrics
Considering that more granular experiment metrics (less than one hour) can be noisy, and computation on demand isn’t efficient, we decided to have an hourly cron job to pre-compute these metrics for the past hour. When we go to the real-time dashboard, these pre-computed metrics loads instantly. Each cell is the metric for one hour.
Real-Time Metrics
We can also compute the metrics on demand within last hour, which gives us the capability to view insights right after an experiment launches.
Applications
Validate triggering
Triggering issues are still among the more common, including:
- We may forget to activate the experiment or call the wrong API, so that no Pinners are logged
- Or we may activate the experiment incorrectly, so that Pinners in one group are never triggered
- Or Pinners seeing the treatment are incorrectly triggered into a control group
Avoiding these triggering issues is key for running successful experiments.
In order to prevent mistakes, it’s always a good idea to verify that triggering is working properly for all the groups before turning them on (expand the group size from 0 to 1 percent, for example). We previously used to tail Kafka topics to find triggering records, which was painful for most developers. With the real-time experiment dashboard, the validation can be done for free. Once we’ve triggered all the groups, we can compute the on-demand metrics, and it’ll show us how many Pinners were triggered into each group within a specified time interval.
Confirm group size change
As our new experiment platform allows the group size change to take effect almost immediately, it’d be great to also confirm the group change in real-time. After making the group size change, we can check out the pre-computed hourly metrics after an hour. For example, if we ramp up from 1 to 5 percent, the new hourly Pinners joined should be roughly 5x compared to the previous hour. If we don’t want to wait, we can also compute the metrics on-demand and do rough estimates.
Check Group Balance
Unbalanced groups is another common issue among experiments, and so the sooner we can detect the unbalance, the better. Again, the real-time experiment dashboard can help. After ramping up the group sizes for a few hours, we can look at the pre-computed hourly metrics, which will show how many distinct users were triggered into each group in the last few hours.
Monitor Core Metrics
Another use case for real-time experiment dashboard is detecting disastrous changes quickly. After ramping up the group size or making any change, we can see how the core metrics are performing. If the metrics are significantly down, we should look into the experiment immediately and see if there are any bugs. We may also want to turn off the experiment for investigation and prevent further damage.
Summary
Real-time experiment metrics is tremendously helpful for getting quick insights into experiments. This system has been in production for more than six months, and has already helped us in numerous situations. If you’re interested in experiment framework and analytics platforms, join us on the Data Engineering team!
Acknowledgements: Multiple teams across Pinterest provide insightful feedbacks and suggestions building the realtime experiment dashboard. Major contributors include Bryant Xiao, Chunyan Wang, Justin Mejorada-Pier, Shuo Xiang, Yu Yang, John Elliott and the rest of Data Engineering team.
Get The SingleStore Spark Connector Guide
The 79 page guide covers how to design, build, and deploy Spark applications using the SingleStore Spark Connector. Inside, you will find code samples to help you get started and performance recommendations for your production-ready Apache Spark and SingleStore implementations.
Download Here