If you ever catch yourself doing mental arithmetic, or writing complex queries while trying to debug a capacity or performance problem, it’s a sign that your database is missing a feature. The information you need may exist, but it’s scattered.
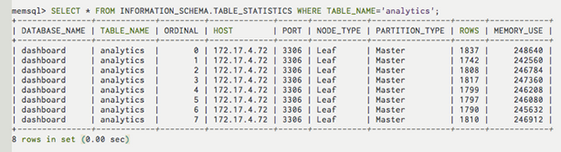
One of the most frequent feature requests from our users was more detailed statistics about memory use. In the current version of SingleStore tables are stored in memory (hence the name), so memory management and storage capacity planning are essentially the same activity. In SingleStore version 2.6 there is a new table in information_schema that exposes those statistics:
Each row describes a “partition” of a distributed table, or a copy of a reference table. You can roll this table up in lots of ways to generate things like the total size of a table in the cluster.
One thing to watch out for in any distributed database is “skew.” The rows in a database can be distributed around the machines in the cluster randomly, which ensures that every node has more or less the same amount of data. But they can also be sharded according to the values in one or more columns. For example, a “hits” table in a web traffic log could be sharded by the IP address of the client. This has many nice properties, but can also cause the data to be spread unevenly. An ISP might employ a proxy, for example, so a large amount of traffic might appear to come from a single IP address, and send a lot of rows to the same partition.
To measure skew you count up the number of rows in and the space consumed by each partition and see how much they vary from the average. A handy statistical function for this is the “relative standard deviation”, expressed as stddev()/avg(). As a general rule of thumb, anything below 0.05 is an acceptable amount of skew.
It’s nice to have the data available, but typing these queries from memory is tiresome. SingleStore Ops is a performance and monitoring application built on top of the database, and runs inside the browser. Building visualizations that combined table_statistics with the table schema was a joy.
How new features get made
There’s always too much to do. The set of features you could write is nearly infinite, so having a way to choose the right ones to do next is crucial. These new table stats features developed side-by-side in the interplay between our “engine” team, which builds the database, and the “ops” team, which builds monitoring and performance apps on top. Ops folks generally ask for better data, and Engine folks generally ask for better visualizations. Having a demanding customer on the inside shortens the feedback loop immensely and makes for better software.
For example, the ops team wanted more detailed information about the size of values in each column in a table. They wrote a query that scanned every field in every row in every table in every database in the cluster, and set it to run every 60 seconds. This accomplished two things simultaneously. It allowed table statistics UI to be prototyped quickly using real data. It also horrified the engine team so much that they built a way to get at those statistics much more cheaply.
“The best way to get the right answer on the Internet is not to ask a question, it’s to post the wrong answer.”
All of these engine features are available today with SingleStoreDB Self-Managed 2.6. The new UI features will ship with SingleStore Ops 3.0 in a few weeks. Enjoy!